We’ll focus on three major sources of data that are used in various degrees for irrigation scheduling support. My premise here is that these data sources have not remained static but have indeed improved significantly over time.
 Precision Irrigation Scheduling: Should We Have A Problem? (Part 2)

Caleb Midgley | Iteris, Inc.
Reprinted with permission for the Iteris blog:
In the first installment of this three-part blog series we began to dive into the numbers from the USDA Farm & Ranch Irrigation Survey from (2013). In particular, we took a look at the sobering adoption numbers for what one might call “precision irrigation scheduling” techniques. These techniques included well-known methodologies such as soil-moisture sensing, evapotranspiration (ET) based scheduling, and spectral techniques. Overall, we saw that what worked in the 1990s seemed to be sufficient for present-day irrigation scheduling operations.
As a product of the Gen-X hoard I’ll admit that 90s music still blares on my headphones from time to time. However, the delivery of that music and the sound quality has certainly changed. In the same vein, I would argue that the advancement in irrigation delivery technology and the quality of the underlying irrigation decision support data itself has improved just as dramatically as these non-agricultural technologies over the past few decades. And yet, we see the flatline of adoption in Figure 1:
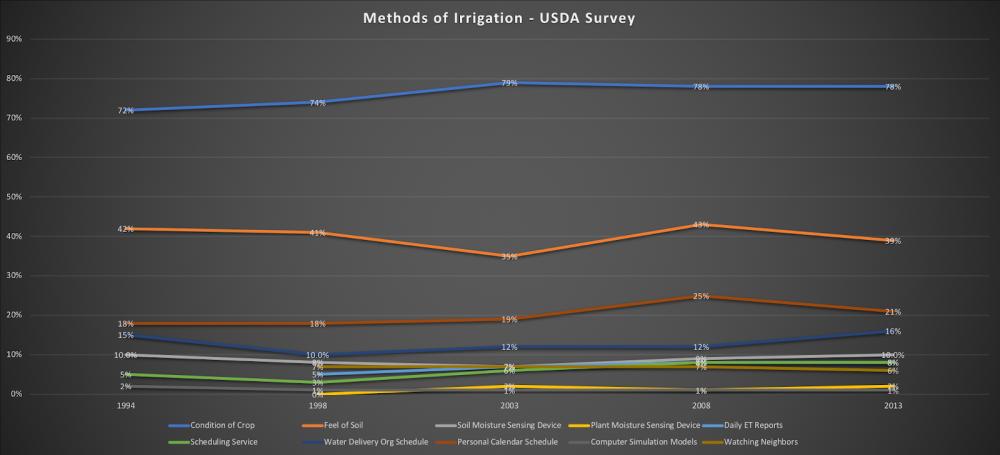
Figure 1
But let’s not beat this dead horse shall we? In part one I promised to look at some rays of light when it comes to irrigation scheduling. In particular, we’ll focus on three major sources of data that are used in various degrees for irrigation scheduling support. My premise here is that, just like the information delivery technology of the 90s, these data sources have not remained static but have indeed improved significantly over time.
Mr./Ms. Forecaster is Getting Better
Okay, I’m biased here as I have a meteorological background. But if we can objectively step back and look at how far the meteorological sciences have come in the past 20-30 years, it is fairly breathtaking. The atmosphere is a chaotic system, making it inherently unpredictable after a certain amount of time. And yet, those five-seven day forecasts are getting better and better. What gives? Let’s start with the data.
Observations Abound. A chaotic system is characterized by small input errors subsequently becoming big errors over time. That being the case, there is always an emphasis on getting better input data when it comes to atmospheric modeling and prediction. Additionally, we all know about microclimates. Just because the airport 10 miles away is above freezing does not mean your orchard is safe, especially if the terrain varies between the two. Fortunately, we are seeing more and more data inputs, both from public and private data sources.
Figure 2 shows the increase in data ingestion for the Climate Reanalysis System run by NOAA. Basically, it creates a historical atmosphere that is continually updated over time. Quite a ramp up in the last 20-30 years wouldn’t you say? In 2009, you’re looking at over 150GB of data ingested per month and I’m quite sure that number has increased in the past 10 years. In addition to surface observations, you’ve got satellite, radar, wind profiler, weather balloon, and aircraft data being ingested, to name a few. This is important because the better your inputs, the greater your accuracy in time. These same types of inputs are used in today’s numerical weather prediction models and at greater volume/coverage. Which leads us to…..
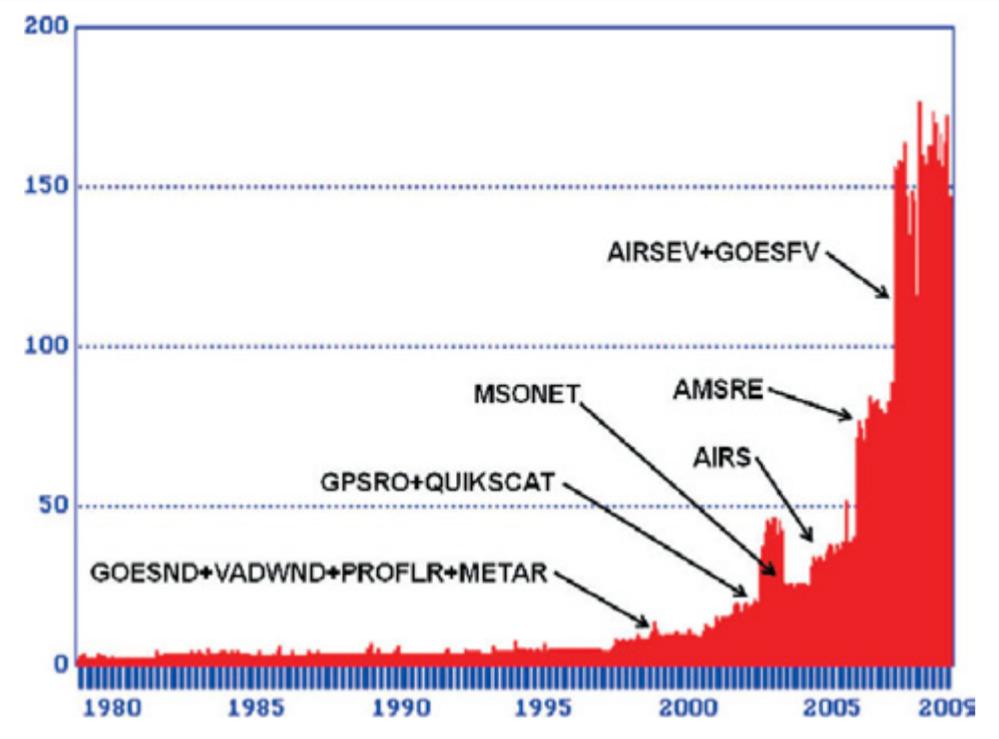
Figure 2: Diagram illustrating CFSR data dump volumes, 1978–2009 (GB month−1). Source: The NCEP Climate Forecast System Reanalysis.
Forecast Skill is a Thing. With all of these inputs for today’s data assimilation methods to work with, it makes sense that forecasts are getting better and better. In fact, the one aspect of irrigation scheduling that I believe may be underutilized is the inclusion of meteorological forecast data to estimate future water demand. Related to that, my colleague Brent Shaw has an excellent article on forecast accuracy here, where he notes that precipitation forecasting is generally 80% accurate for lead times of three days. That’s pretty good and is something you can put high levels of confidence in. As we go into the future, you can have even greater confidence in this number. Why is that? The European Centers for Medium Range Weather Forecasting (ECMWF) found that after 25 years of ensemble model improvement that:
- The accuracy of 500 hPA features, which captures large scale ridges/troughs in the upper atmosphere, improves by 1.5 days lead time every decade. In other words, the five-day forecast today of upper-level troughs and ridges is as skillful as the two-day forecast was in 1999.
- Even more relevant to irrigation scheduling, precipitation forecasts had a predictability gain of four days over a 15-year period. So the five-day precipitation forecast today is as accurate as the one-day forecast was in 2004.
Those are pretty heady numbers and should create significant confidence in tools that utilize a forecast component in addition to historical data to develop irrigation recommendations.
Subsurface Knowledge is Getting Better
In addition to the substantial improvement we are seeing in assessing what’s happening above the soil, we are also advancing quickly when it comes to the happenings below the soil surface. Those same advanced data assimilation and modeling systems talked about in the previous paragraphs are also coupled with land surface models (LSMs) that solve the physical equations for energy and water transport beneath the surface. If given the right inputs, the results are impressive.
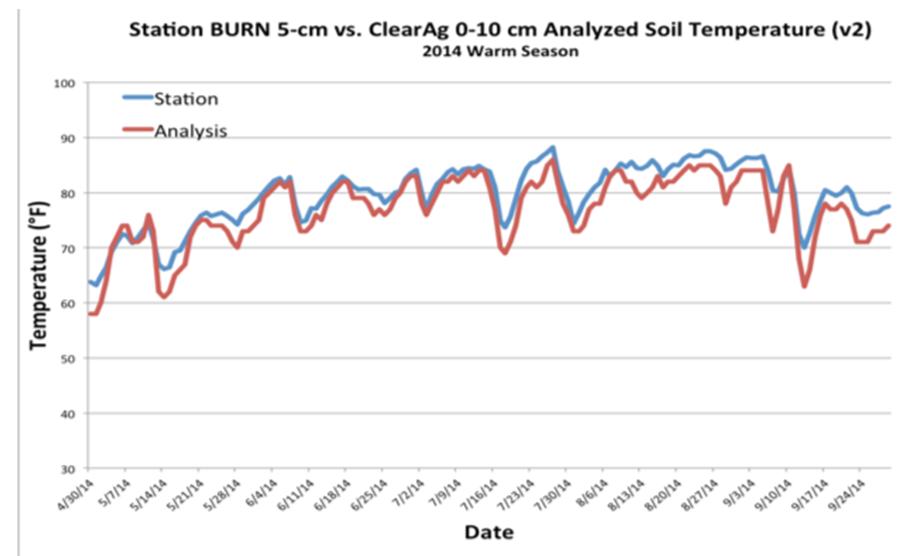
Figure 3A
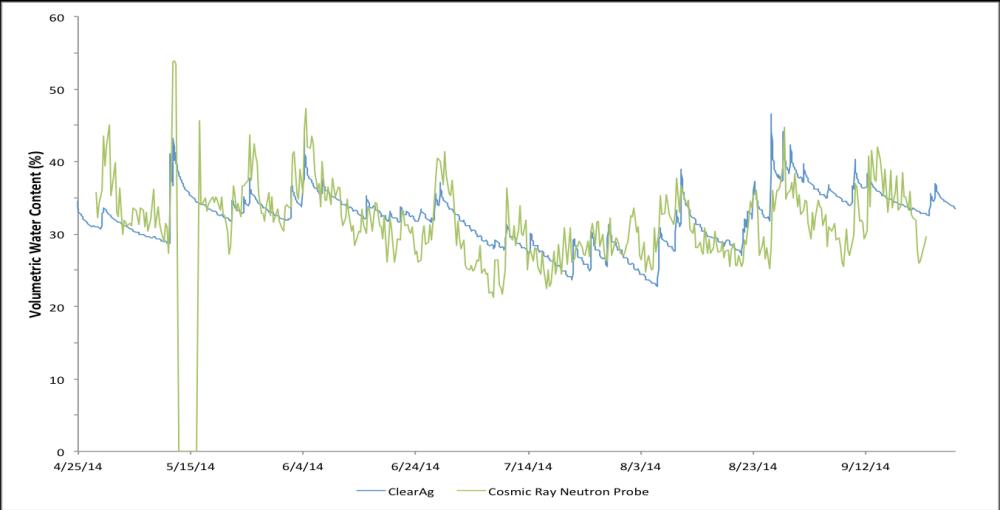
Figure 3B
Figure 3 shows the results of such an LSM in comparison to a soil temperature sensor and a cosmic ray neutron probe for soil moisture. Additionally, as soil moisture probe data becomes more available for ingest via Internet of Things (IoT) systems, it is easy to see how the addition of that data to LSMs will only increase the skill over time as model output for fields near a probe are calibrated with such ground truth data.
Crop Characterization
Finally, to truly take advantage of good meteorological and soil data, you need to understand how it interacts with the crop in your field. Knowing this will lead to better irrigation recommendations. One approach to this is the use of crop models. A wonderful quote comes to mind from the great statistician George Box: “Essentially all models are wrong, but some are useful.” And he’s absolutely right! Every model is an approximation concerning the way nature behaves, but that doesn’t mean the approximation has no utility.
Indeed, as these models get better, so does their utility. Generally crop models have been based on growing degree units (GDUs) in the past and these are still stalwarts in the modeling world. However, new technologies such as neural networks are leading to the ability for crop models to be generated for a specific location and variety taking into account much more than GDUs. Figure 4 is an example of such a model, which looks at soil moisture and average daily temperature as an influencer on growth stage prediction, not just GDUs.
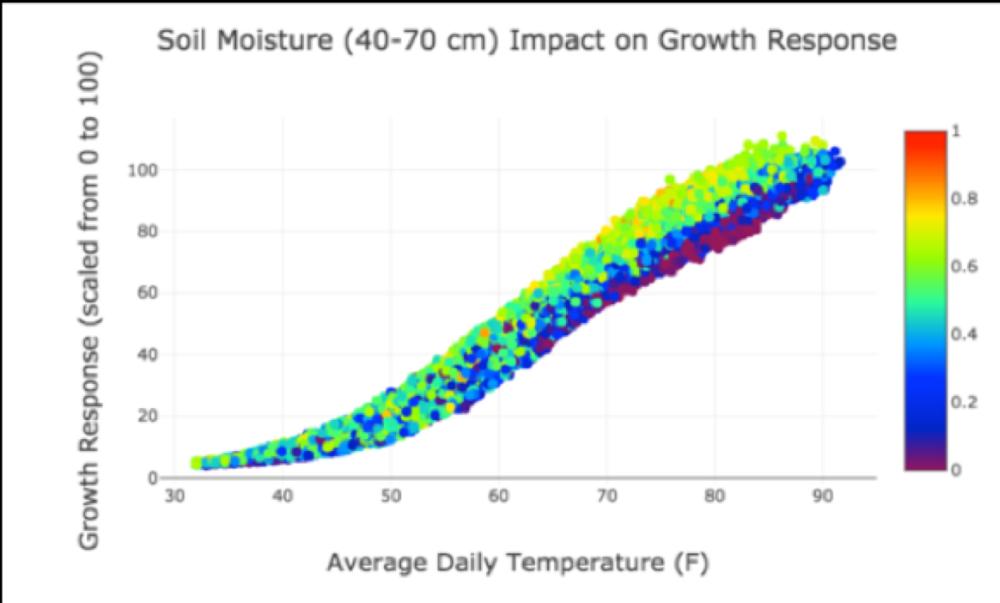
Figure 4. Growth stage neural network model.
The Bottom Line
The 90s were great, but almost 30 years later innovation in the meteorological, soil, and crop modeling space has marched ahead with fantastic results. If delivered in a manner that is proven useful to agricultural producers, I believe these technologies will change the trajectory of the precision irrigation adoption curve quite dramatically.
In the final blog of this series, we’ll talk some more about the useful delivery of this technology, resulting in a realization of the chasm jump discussed in part one.
The content & opinions in this article are the author’s and do not necessarily represent the views of AgriTechTomorrow
Comments (0)
This post does not have any comments. Be the first to leave a comment below.
Featured Product

